
Key Words: biostatistics, descriptive statistics, P values, confidence intervals, public health
Abstract
INTRODUCTION
Research projects use statistical resources to express in numerical or graphic terms different magnitudes like frequencies, differences or associations.
OBJECTIVES
The purpose of this paper is to describe the statistics tools utilization, with special emphasis in the use of conventional statistical tests and confidence intervals, to communicate results in a renowned public health peer reviewed journal in Colombia.
METHODS
We included the 84 articles published in the journal between 2013 and 2014.
RESULTS
The most used resource is frequency analysis (89.3%), followed by p values (65.5%) and confidence intervals (53.6%); 48.9% of the papers used confidence intervals together with p values; 29.8% use neither of them; 16.7% of the articles only used p values and 4.8% only confidence intervals.
CONCLUSIONS
Descriptive statistics is a tool widely used in research results presentation; the critics and caveats suggesting to avoid the exclusive use of the statistical signification test in the results presentation are not followed in the analysis and presentation of the research results.
Introduction
The development of research projects often requires the use of mathematical tools in order to express different magnitudes in numerical terms or graphics such as frequencies, parameters differences or associations, which have emerged in different fields of science as a resource to help visualize and answer research questions. These can be classified in descriptive or summary measures such as mean, standard deviation or frequencies, or in an inferential manner including the so called “null-hypothesis significance tests” and confidence intervals, to mention the basic and most widely used [1].
The application of descriptive measures has been widely proven, and they are of great use in helping to achieve many interesting and incisive results. However, the use of inferential resources such as null-hypothesis significance tests is more controversial.
Null-hypothesis significance tests were introduced in the 1920s as a resource that revolutionized inferential techniques. They were initially proposed by Ronald Fisher who introduced the concept of "null hypothesis", which generally states that there is no relationship between two measured phenomena, or no differences between groups. Fisher's contribution was centered on his famous concept of p values [2].
Jerzy Neyman and Egon Pearson published a paper in 1928 [3] suggesting a procedure intimately linked with Fisher´s proposal, although different both in an operational and epistemological manner. It was conceived in order to choose between two possibilities: the so-called null hypothesis and an alternative one. Since the nineteen fifties until today a combination of these two methods has been applied [1],[4]: given some data obtained from an observation or experiment, a "p" value is calculated using resources associated with the corresponding statistical significance test. When the p value is below a certain pre-established threshold (usually equal to 0.05) the null hypothesis is implicitly rejected, it is stated that "significance has been found" and the actual p value obtained is presented.
Although its use has become popular in many disciplines, null-hypothesis significance tests have been extensively criticized by renowned specialists in the field of statistics, focusing on its logical weaknesses and limitations, as well as for epistemological reasons [5],[6],[7],[8],[9]. Silva et al [4] described some of them, which included:
- It is possible to obtain a p-value as low as desired by simply increasing sample size. Given this, the conclusions depend more on the resources available, those that allow a large sample size, than on the reality being studied.
- In practice, null-hypothesis significance tests simply provide a binary response (acceptance or rejection; significance or non-significance), without requiring a reasonable interpretation of the results. This orthodox approach limited to a dichotomy, offers a simplistic view that ignores the assessment of effects as demanded in science.
Given that this refers to a mathematical concept, a statistically significant association may not be clinically relevant and may not be causal. Moreover, a non-statistically significant association is not necessarily irrelevant. Since it is well known that "significance hunting” seduces both authors and publishers, it is especially pertinent to note that it is common to find "statistically significant but conceptually spurious" associations, as recently emphasized in a highly recognized journal (Nature) [10]. Despite the above, the uncritical reproduction of the method is still part of a ritual that feeds many texts and statistics courses.
In light of these shortcomings, several alternatives to the use of null-hypothesis significance tests have been proposed in recent decades. Among them, the most prominent one is to present the magnitude of the effect accompanied by a measurement of the error associated with the estimate. Confidence intervals not only meet this requirement, but also provide more information than null-hypothesis significance tests, while operating under a logic that does not "force" us to dichotomize conclusions.
Although it is possible to cite dozens of articles that adhere to this suggestion, it is sufficient to note that, since 1988, the International Committee of Medical Journal Editors (ICMJE), also known as the "Vancouver group", incorporated in its recommendations for authors [11], the calculation of confidence intervals. Thus, implying that analysis which solely depend on null-hypothesis significance tests and p values should be avoided.
Due to their potential in establishing trends in the use of statistics, and considering that they can serve as a reference for the authors to reconsider their inferential paradigms, the purpose of this study is to describe the recent use of simple statistical tools as well as the use of p values and confidence intervals, for the presentation of research results in the articles published in a recognized Public Health Journal in Colombia.
Methods
All original articles published in the National Journal of Public Health (Revista Nacional de Salud Pública) of the National University of Colombia during 2013 and 2014 were included. This is a unique set of items, limited to a given biennium and to a specific journal. However, it can be understood as a sample of a superuniverse as defined by Hagood [12]: the work currently being carried out in this field and published after rigorous peer review in the Latin American context.
All original papers which presented results of experimentation or observation were included in the study. Review articles and theoretical or methodological articles were excluded.
The presence or absence of 12 statistical resources was identified for each article: rates, frequencies (absolute or relative ones), means, medians, standard deviations, charts (bar, pie, line, trend or other), p values and confidence intervals.
Conditions under which each article was assessed by researchers were established, and subsequently, a pilot study with 20 papers was carried out. Every article was assessed by the first four authors. A Kappa coefficient in its variant for multiple classifiers was calculated using EPIDAT (version 4.1) [13] for each of the 12 variables. Results are presented in Table 1.
This was certainly a poor result which reveals the difficulty in achieving consistency between observers even in apparently simple cases. A careful examination of the discrepancies led to additional adjustments. Since discrepancies were almost entirely due to the fact that the operational rules of the concepts involved were interpreted differently by observers, the adjustments consisted basically in refining or clarifying these operational definitions in order to ensure adequate consistency of the information that was going to be collected.
In the final assessment, 84 articles that met the conditions for inclusion in the biennium were considered. Each investigator performed a complete reading of all articles in the sample.
In all cases, a positive result was considered in cases in which the resource in question appeared at least once in the results, and negative when it does not appear or when it was only mentioned in the introduction or in an another part of the article referring to previous work.
Results
Upon review of the journal website (http://www.revistas.unal.edu.co/index.php/revsaludpublica), all issues of the 2013 volume, and three of the six issues of the 2014 volume were available (Table 2).
Table 2. Original papers by year of publication in the selected journal.
The most frequently statistical resource used in the presentation of research results were absolute or relative frequencies (89.3 %) usually expressed in percentages, followed by p values (65. 4%) and confidence intervals (53.6 %). Moreover, rate was the resource less frequently used (14.3 %).
Regarding graphics, bar and line charts or trends were the most commonly used (15.4 %), although generally the use of graphics was scarcely noticeable when presenting results of studies (Table 3).
In almost half of the articles (48.9 %; 95% CI = 37.7 to 59.9) both confidence intervals and p values were present. The isolated use of p value was present in one of six papers (16.7 %; 95% CI = 9.9 to 26.4) and the use of confidence intervals without p values was extremely small (4.8 %; 95% CI = 1.3 to 11.7) (Table 4).
Discussion
One of the interesting findings provided by this study concerns the use of descriptive statistics as a sole tool to present the results of research. It is assumed that the journal publishing team is zealous in corroborating that the questions raised by the authors have been effectively answered. The fact that 29.8 % of the articles used neither null-hypothesis significance tests nor confidence intervals reveals the expressive power of descriptive statistics. The use of purely descriptive measures allows many interesting and insightful results; somehow our results validate this reality.
One role of statistics is to provide objective quantitative alternatives in order to avoid, as far as possible, subjectivity and bias in the process of obtaining knowledge. Significance tests are often seen as less than ideal when seeking objectivity, since they, as it is believed, can generate conclusions independently of the people who use them [14].
Although objectivity is a natural and legitimate desire, in the strict sense, it is an unattainable goal. Statistics can not fully solve this conflict given that all inferential processes will always have a subjective component. While statistical techniques can be very useful, they tend to promote a belief, which many times disregard the need to examine reality through comprehensive thinking [15].
In Public Health, non-systematic reflections have been made about the use of statistical significance tests and their ability to measure, quantify or assess differences between objects under investigation. However, the value of p itself does not provide information regarding the global importance or qualitative meaning when results are applied, and provides no information about possible future outcomes in the general population [16].
In this regard, it could be a fallacy to consider in a complex world, that the calculation of p values can provide enough information to answer research questions, given that it only refers to dichotomous conclusions. Consequently, its use may threaten the construction of useful knowledge for the decision making process in the real world [17].
In the first place, research questions that are addressed based on the logic of p values are only those that inquire about differences between groups being compared. On the other hand, p appeal as a sole tool to present results and values is insufficient, given that it is the only information that could be useful in constructing a biased, fragmented and often unconnected with life discourse.
In this regard, Manterola and Pineda´s concept [17] is worth noting. They claim that statistical significance is nothing more than that, "statistical significance", meaning that it can sometimes be positive and clinically irrelevant, or negative without necessarily signifying that there are no real differences between the variables being studied.
Despite the recommendation of the International Committee of Medical Journal Editors (ICMJE) back in 1993, on avoiding sole reliance on hypothesis testing for the presentation of research results, given that it fails to transmit information on the effect size [11], and after decades of objections by various authors [5],[8],[17],[18],[19],[20],[21]; null-hypothesis significance tests not even accompanied by confidence intervals, are still regularly used. Cohen [22], in a paper intensely cited during the last two decades, considers that the use of the p-value approach to hypothesis testing is nothing more than a current ritualization that has been occurring over the last 40 years; the present review extends this reality over another 20 years. Our results reveal that such warnings are not fully taken into account in Public Health research.
A previous study, similar to this investigation [4] found that 21 % (95% CI = 16-26) (n = 306) of items reviewed during the 2005-2006 period, only use p values for the presentation of research results. This result is similar to ours (16.7 %, 95% CI: 9.9 to 26.4) in which the lower end of the confidence interval confirms that at least 10 % of the studies seem to incur in this practice that is explicitly condemned by the most recognized methodological authorities.
In the same study [4], they also reported that only 14 % (95% CI = 9-17) of the articles reviewed in the 2005-2007 period did not use confidence intervals without appealing to p values, while in this study the results were even lower (4.8 %; 95% CI = 1.3 to 11.7).
A limitation of the present study is that data were collected only for a short period and a single journal was evaluated. However, the idea of offering a portrait of current practices is essentially valid despite this limitation.
Conclusions
Descriptive statistics is a commonly used tool. In the inferential realm however, criticisms and warnings by the International Committee of Medical Journal Editors, which condemn the use of null-hypothesis significance tests for the analysis and presentation of research results, are still not taken into account by a significant number of authors. Moreover, it also reveals that journal editors do not always demand compliance with this recommendation.
Notes
From the editor
This article was originally submitted in Spanish and was translated into English by the authors. The Journal has not copyedited this version.
Conflicts of interests
The authors have completed the conflict of interests declaration form from the ICMJE, and declare not having any conflict of interests with the matter dealt herein. Forms can be requested from the responsible author or the editors.

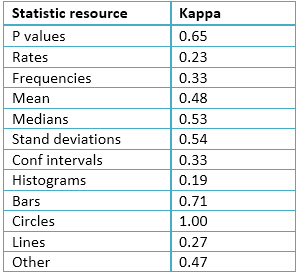 Table 1. Kappa values corresponding to several reviewers of binary variables for each statistical resource considered in the study (pilot study: n=20 articles).
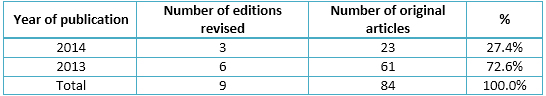 Table 2. Original papers by year of publication in the selected journal.
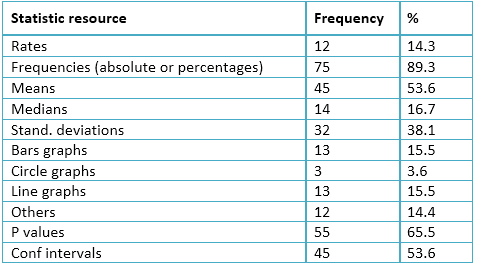 Table 3. Frequency of the employment of descriptive resources. National Journal of Public Health (RNSP) of the National University of Colombia, 2013-2014 (n = 84).
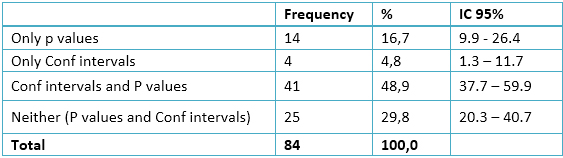 Table 4. Frequency of use of p values and confidence intervals. National Journal of Public Health (RNSP) of the National University of Colombia, 2013-2014 (n = 84).
 Esta obra de Medwave está bajo una licencia Creative Commons Atribución-NoComercial 3.0 Unported. Esta licencia permite el uso, distribución y reproducción del artículo en cualquier medio, siempre y cuando se otorgue el crédito correspondiente al autor del artículo y al medio en que se publica, en este caso, Medwave.
INTRODUCCIÓN
El desarrollo de proyectos de investigación suele demandar del uso de herramientas matemáticas para expresar en términos numéricos o gráficos diversas magnitudes, tales como frecuencias, diferencias, o asociaciones.
OBJETIVOS
El presente estudio se propone describir la utilización que se hace de las herramientas estadísticas básicas, haciendo especial énfasis en el uso de las pruebas de significación estadística y los intervalos de confianza, para la presentación de resultados de investigación en los artículos publicados en una reconocida revista de la salud pública en Colombia.
MÉTODOS
Se realizó una revisión de los 84 artículos originales publicados en dicha revista entre 2013 y 2014.
RESULTADOS
El recurso más empleado es la utilización de análisis de frecuencias (89,3%), seguido de los valores p (65,5%) y los intervalos de confianza (53,6%); el 48,9% de los artículos utiliza a la vez intervalos de confianza y valores p para la presentación de resultados y el 29,8% ninguno de los dos. El 16,7% de los artículos sólo utiliza valores p y el 4,8% sólo intervalos de confianza.
CONCLUSIONES
La estadística descriptiva es una herramienta que se utiliza con asiduidad en la presentación de resultados y que las críticas y advertencias sugiriendo que se evite el uso exclusivo de las pruebas de significación estadística en la presentación de resultados no son cabalmente tenidas en cuenta en el análisis y presentación de los resultados de investigación.
Authors:
Víctor Arcila Quiceno[1], Elizabeth García Restrepo[1], Natalia Gómez Rúa[1], Gino Montenegro Martínez[1], Luis Carlos Silva Ayçaguer[1,2]
Affiliation:
[1] Facultad de Medicina, Universidad CES, Medellin, Colombia
[2] Escuela Nacional de Salud Pública, La Habana, Cuba
E-mail: gnmontenegro@gmail.com
Author address:
[1] Tr 5 # 41-15
Bogotá
Colombia
Citation: Arcila Quiceno A, García Restrepo E, Gómez Rúa N, Montenegro Martínez G, Silva Ayçaguer LC. Statistical tools in published articles of a public health journal in 2013 and 2014: bibliometric cross-sectional study. Medwave 2015 Aug;15(7):e6238 doi: 10.5867/medwave.2015.07.6238
Submission date: 2/7/2015
Acceptance date: 24/8/2015
Publication date: 31/8/2015
Origin: not requested
Type of review: reviewed by two external peer reviewers, double-blind
Comments (0)
We are pleased to have your comment on one of our articles. Your comment will be published as soon as it is posted. However, Medwave reserves the right to remove it later if the editors consider your comment to be: offensive in some sense, irrelevant, trivial, contains grammatical mistakes, contains political harangues, appears to be advertising, contains data from a particular person or suggests the need for changes in practice in terms of diagnostic, preventive or therapeutic interventions, if that evidence has not previously been published in a peer-reviewed journal.
No comments on this article.
To comment please log in
Medwave provides HTML and PDF download counts as well as other harvested interaction metrics. There may be a 48-hour delay for most recent metrics to be posted.
- Läärä E. Statistics: reasoning on uncertainty, and the insignificance of testing null. Annales Zoologici Fennici. BioOne. 2009:138-57. | CrossRef |
- Fisher RA. Statistical methods for research workers. Edinburgh: Oliver and Boyd;1950.
- Neyman J, Pearson ES. On the use and interpretation of certain test criteria for purposes of statistical inference: Part I. Biometrika;1928:175-240.
- Silva-Ayçaguer LC, Suárez-Gil P, Fernández-Somoano A. The null hypothesis significance test in health sciences research (1995-2006): statistical analysis and interpretation. BMC Med Res Methodol. 2010 May 19;10:44. | CrossRef | PMC |
- Goodman SN. Toward evidence-based medical statistics. 1: The P value fallacy. Ann Intern Med. 1999 Jun 15;130(12):995-1004. | PubMed |
- Nicholls N. Commentary and analysis: the insignificance of significance testing. Bull Am Meteorol Soc. 2001;82(5):981-6. | Link |
- Armstrong JS. Statistical significance tests are unnecessary even when properly done and properly interpreted: Reply to commentaries.J of Forecasting 2007;(3):335-36. | Link |
- Hubbard R, Lindsay RM. Why P values are not a useful measure of evidence in statistical significance testing. Theory Psychol. 2008;18(1):69-88. | CrossRef |
- Ayçaguer LCS. Cultura estadística e investigación científica en el campo de la salud: una mirada crítica. Madrid: Díaz de Santos; 1997
- Nuzzo R. Scientific method: statistical errors. Nature. 2014 Feb 13;506(7487):150-2. | CrossRef | PubMed |
- Uniform requirements for manuscripts submitted to biomedical journals. International Committee of Medical Journal Editors. Br Med J (Clin Res Ed). 1988 Feb 6;296(6619):401-5. | PubMed |
- Hagood MJ. Statistics for sociologists. New York: Reynal and Hitchcock; 1941.
- EPIDAT: Análisis Epidemiológico de Datos sergas.es [online]. | Link |
- Silva LC, Benavídes A. Apuntes sobre subjetividad y estadística en la investigación. Rev Cuba Salud Pública. 2003;29(2):170-3. | Link |
- Fethney J. Statistical and clinical significance, and how to use confidence intervals to help interpret both. Aust Crit Care. 2010 May;23(2):93-7. | CrossRef | PubMed |
- Ioannidis JP. Why most published research findings are false. PLoS Med. 2005 Aug;2(8):e124. | PubMed |
- Manterola C, Pineda V. El valor de« p» y la« significación estadística»: Aspectos generales y su valor en la práctica clínica. Rev Chil Cir. 2008;60(1):86-9. | CrossRef |
- Rozeboom WW. The fallacy of the null-hypothesis significance test. Psychol Bull. 1960 Sep;57:416-28. | PubMed |
- Berger JO, Sellke T. Testing a point null hypothesis: the irreconcilability of P values and evidence. J Am Stat Assoc. 1987;82(397):112-22. | CrossRef |
- Anderson DR, Burnham KP, Thompson WL. Null hypothesis testing: problems, prevalence, and an alternative. J Wildl Manag. 2000;64(4):912-23. | CrossRef |
- Nickerson RS. Null hypothesis significance testing: a review of an old and continuing controversy. Psychol Methods. 2000 Jun;5(2):241-301. | PubMed | Link |
- Cohen J. The earth is round (p<. 05): Rejoinder. 1995;50(12). | CrossRef |
Läärä E. Statistics: reasoning on uncertainty, and the insignificance of testing null. Annales Zoologici Fennici. BioOne. 2009:138-57. | CrossRef |Fisher RA. Statistical methods for research workers. Edinburgh: Oliver and Boyd;1950. Neyman J, Pearson ES. On the use and interpretation of certain test criteria for purposes of statistical inference: Part I. Biometrika;1928:175-240. Silva-Ayçaguer LC, Suárez-Gil P, Fernández-Somoano A. The null hypothesis significance test in health sciences research (1995-2006): statistical analysis and interpretation. BMC Med Res Methodol. 2010 May 19;10:44. | CrossRef | PMC |Goodman SN. Toward evidence-based medical statistics. 1: The P value fallacy. Ann Intern Med. 1999 Jun 15;130(12):995-1004. | PubMed |Nicholls N. Commentary and analysis: the insignificance of significance testing. Bull Am Meteorol Soc. 2001;82(5):981-6. | Link |Armstrong JS. Statistical significance tests are unnecessary even when properly done and properly interpreted: Reply to commentaries.J of Forecasting 2007;(3):335-36. | Link |Hubbard R, Lindsay RM. Why P values are not a useful measure of evidence in statistical significance testing. Theory Psychol. 2008;18(1):69-88. | CrossRef |Ayçaguer LCS. Cultura estadística e investigación científica en el campo de la salud: una mirada crítica. Madrid: Díaz de Santos; 1997 Nuzzo R. Scientific method: statistical errors. Nature. 2014 Feb 13;506(7487):150-2. | CrossRef | PubMed |Uniform requirements for manuscripts submitted to biomedical journals. International Committee of Medical Journal Editors. Br Med J (Clin Res Ed). 1988 Feb 6;296(6619):401-5. | PubMed |Hagood MJ. Statistics for sociologists. New York: Reynal and Hitchcock; 1941. Silva LC, Benavídes A. Apuntes sobre subjetividad y estadística en la investigación. Rev Cuba Salud Pública. 2003;29(2):170-3. | Link |Fethney J. Statistical and clinical significance, and how to use confidence intervals to help interpret both. Aust Crit Care. 2010 May;23(2):93-7. | CrossRef | PubMed |Ioannidis JP. Why most published research findings are false. PLoS Med. 2005 Aug;2(8):e124. | PubMed |Manterola C, Pineda V. El valor de« p» y la« significación estadística»: Aspectos generales y su valor en la práctica clínica. Rev Chil Cir. 2008;60(1):86-9. | CrossRef |Rozeboom WW. The fallacy of the null-hypothesis significance test. Psychol Bull. 1960 Sep;57:416-28. | PubMed |Berger JO, Sellke T. Testing a point null hypothesis: the irreconcilability of P values and evidence. J Am Stat Assoc. 1987;82(397):112-22. | CrossRef |Anderson DR, Burnham KP, Thompson WL. Null hypothesis testing: problems, prevalence, and an alternative. J Wildl Manag. 2000;64(4):912-23. | CrossRef |


 Research papers
Systematization of initiatives in sexual and reproductive health about good practices criteria in response to the COVID-19 pandemic in primary health care in Chile
Clinical, psychological, social, and family characterization of suicidal behavior in Chilean adolescents: a multiple correspondence analysis
